Mapping the coolest areas of a city
What is the coolest area in a city determined by trend indicators and data? And which area could be the next hipster hot spot? This question came into my mind when I was walking through Munich and I was seeing lots of new organic stores, coffee shops, and trendy restaurants popping up (replacing burger restaurants with Vietnamese ones) and lots of reconstruction work going on in certain areas of the city. Is there a way to determine the coolness of a neighborhood by data? I create a working prototype to give it a try.

The Concept:
I want to collect the needed data indicators for at least the biggest cities in Europe (as a starting point), process them, and create an algorithm to calculate the coolest area of a city and show the results as a heat map overlay on a map. The map shall be shown on a responsive website to work on as many devices as possible. Why? Just for curiosity and if it’s working well maybe for a decision where you want to move. The PoC for Munich should validate my hypotheses that the number of coffee shops, organic stores combined with the rental fees are indicators for the coolness of a neighborhood. My tool of choice for this project is python with its extensive libraries for data analytics.
The data
I decided to choose the following:
- number of organic stores in general
- number of coffee shops, coffee shops selling organic coffee
- number of bars and restaurants
- the average rental rates per square meter for each area of the city
- number of restaurants and organic restaurants
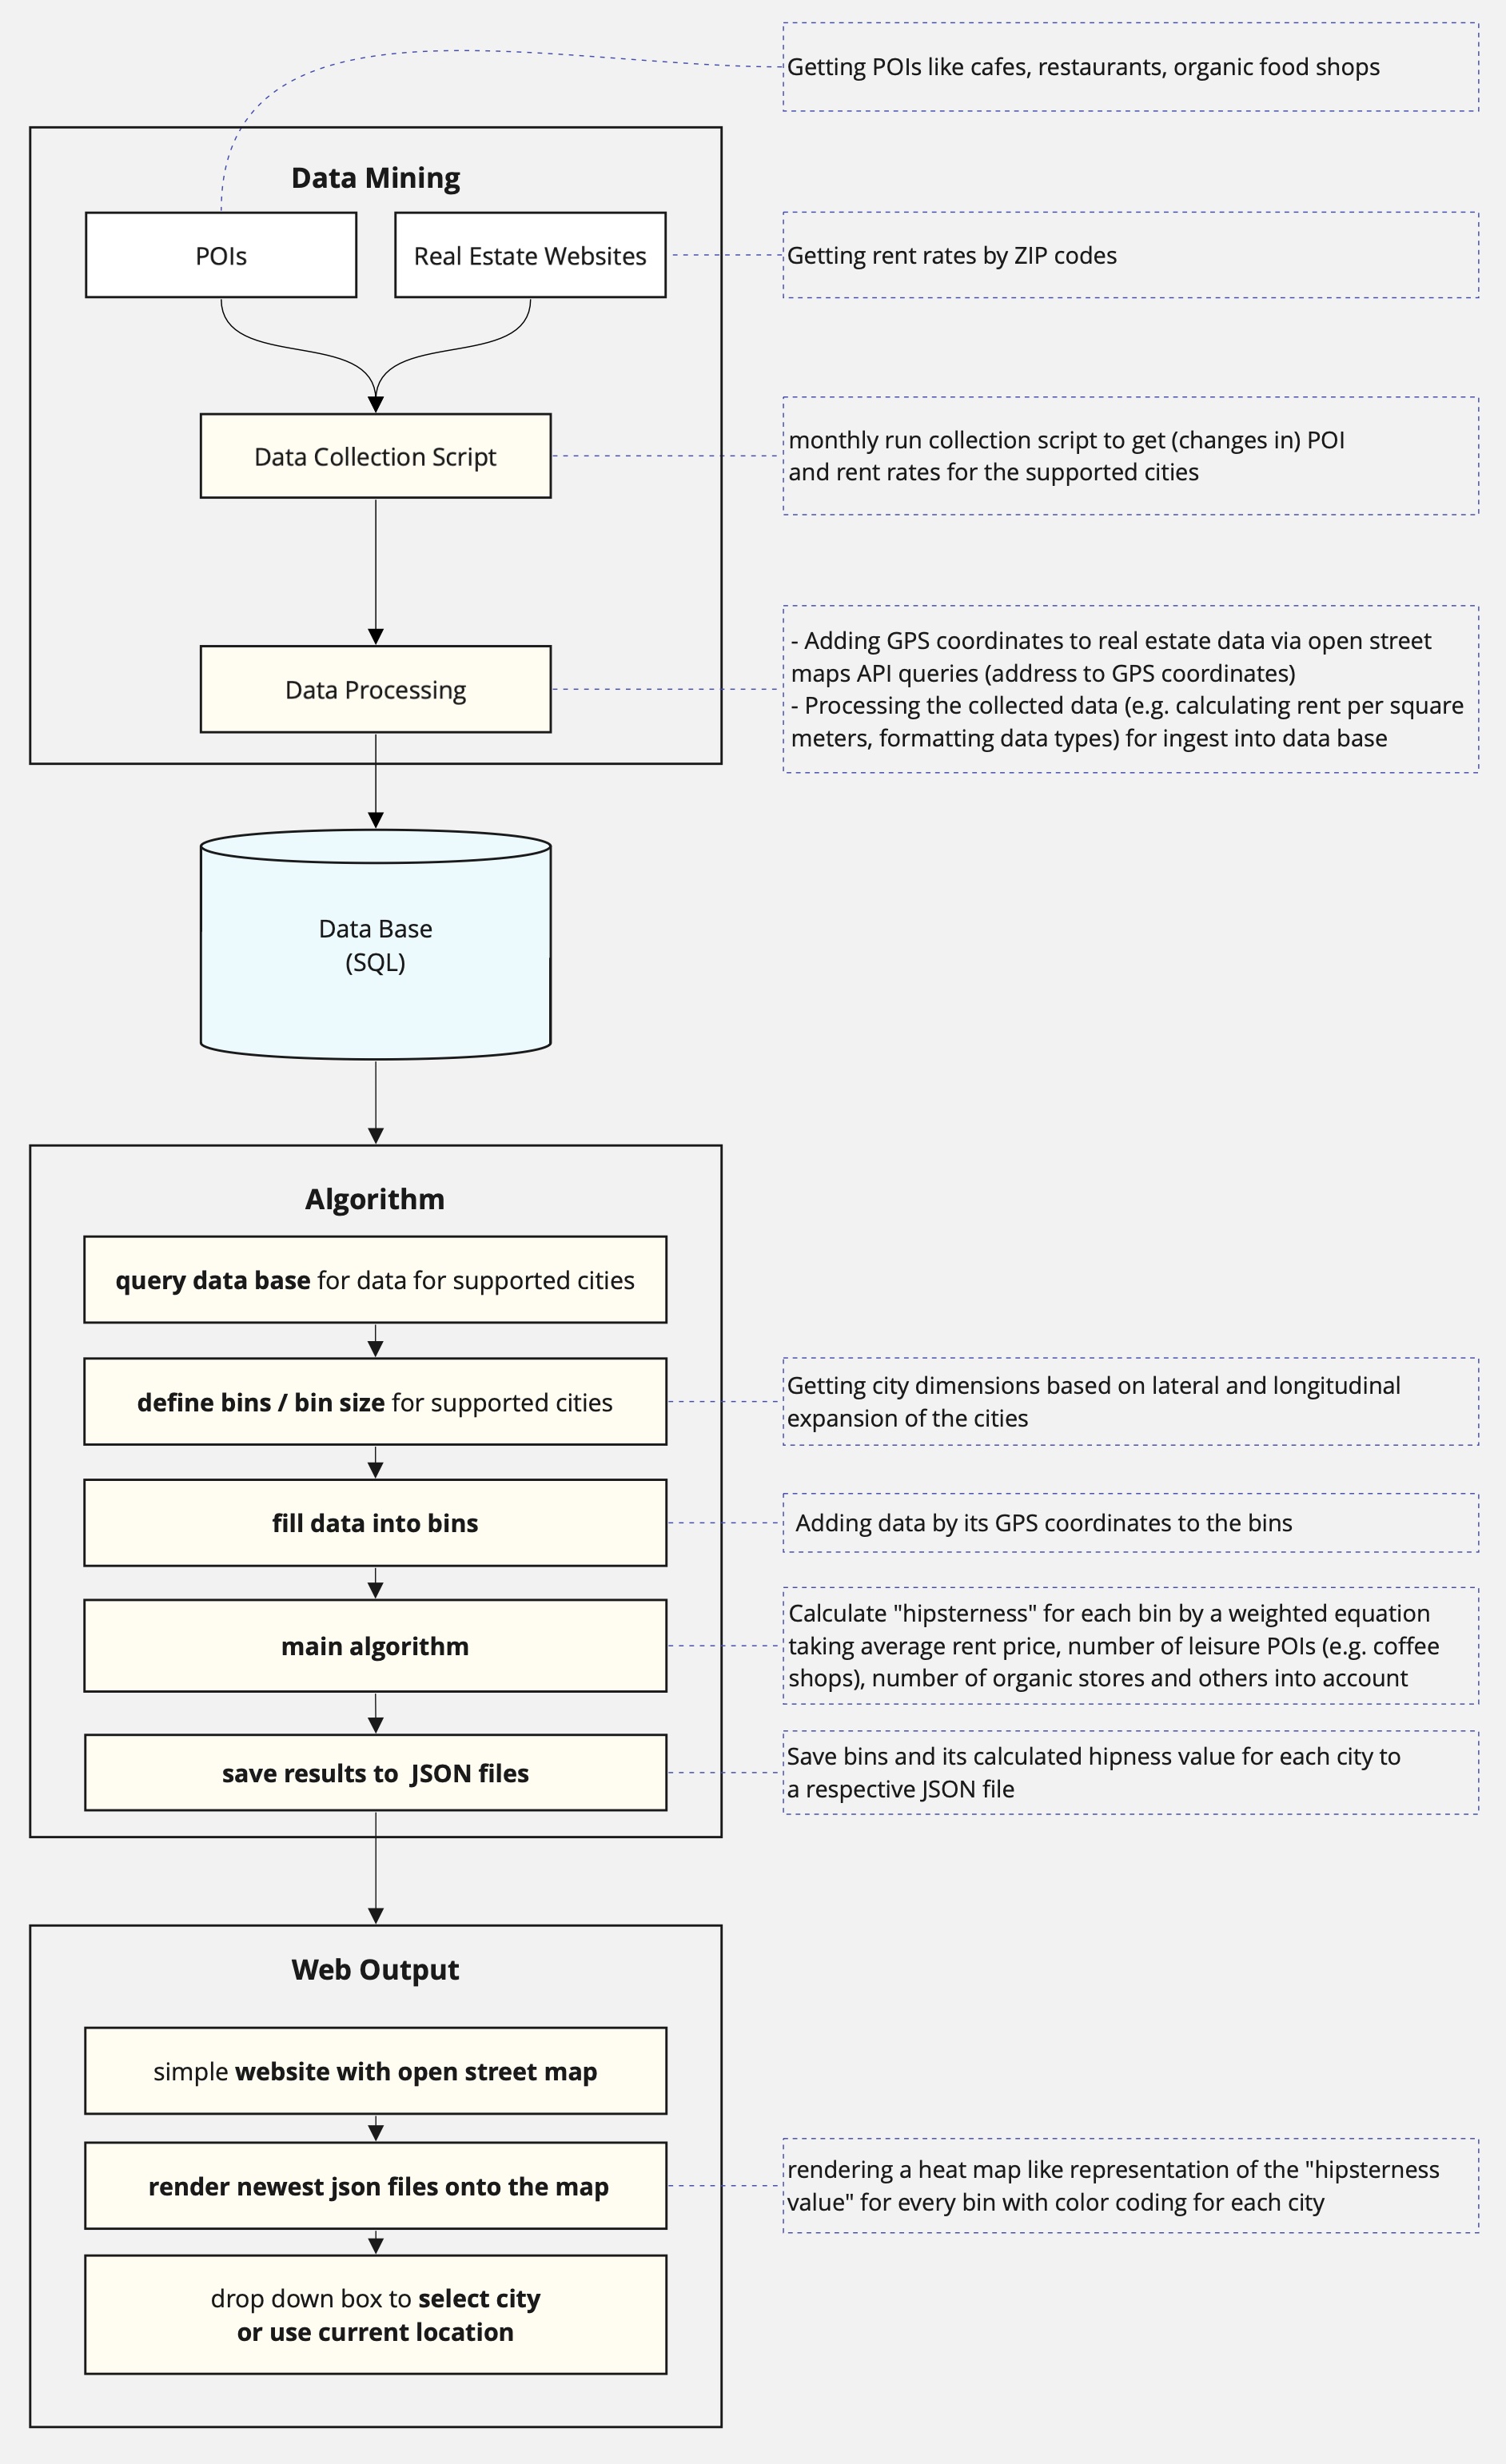
Technically I am pulling the POI data (organic stores, e.g.) for each city from open street maps via their API and collect the rental prices from various real estate websites. This should work for every major city around the world. In addition to that, I get all ZIP codes and the GPS coordinates of the city boundaries also over the open street maps API to narrow the search area for the POIs and rental fees. The data mining script runs regularly to identify changes like rising rental rates and an increasing or decreasing number of the selected POIs. The results of the data mining script are stored with a respective time stamp in a SQL database.
Processing the data
The calculation algo pulls the input data from the SQL database for the selected city. Based on the size of the city bins for clustering the input data by coordinates are created. For each bin the “coolness” is calculated with the number of organic stores, coffee shops, restaurants, bars and rental fees. Because the data in the database is updated regularly the equation also takes the development of the numbers of the defined POIs and rental fees into account.
Showing the data
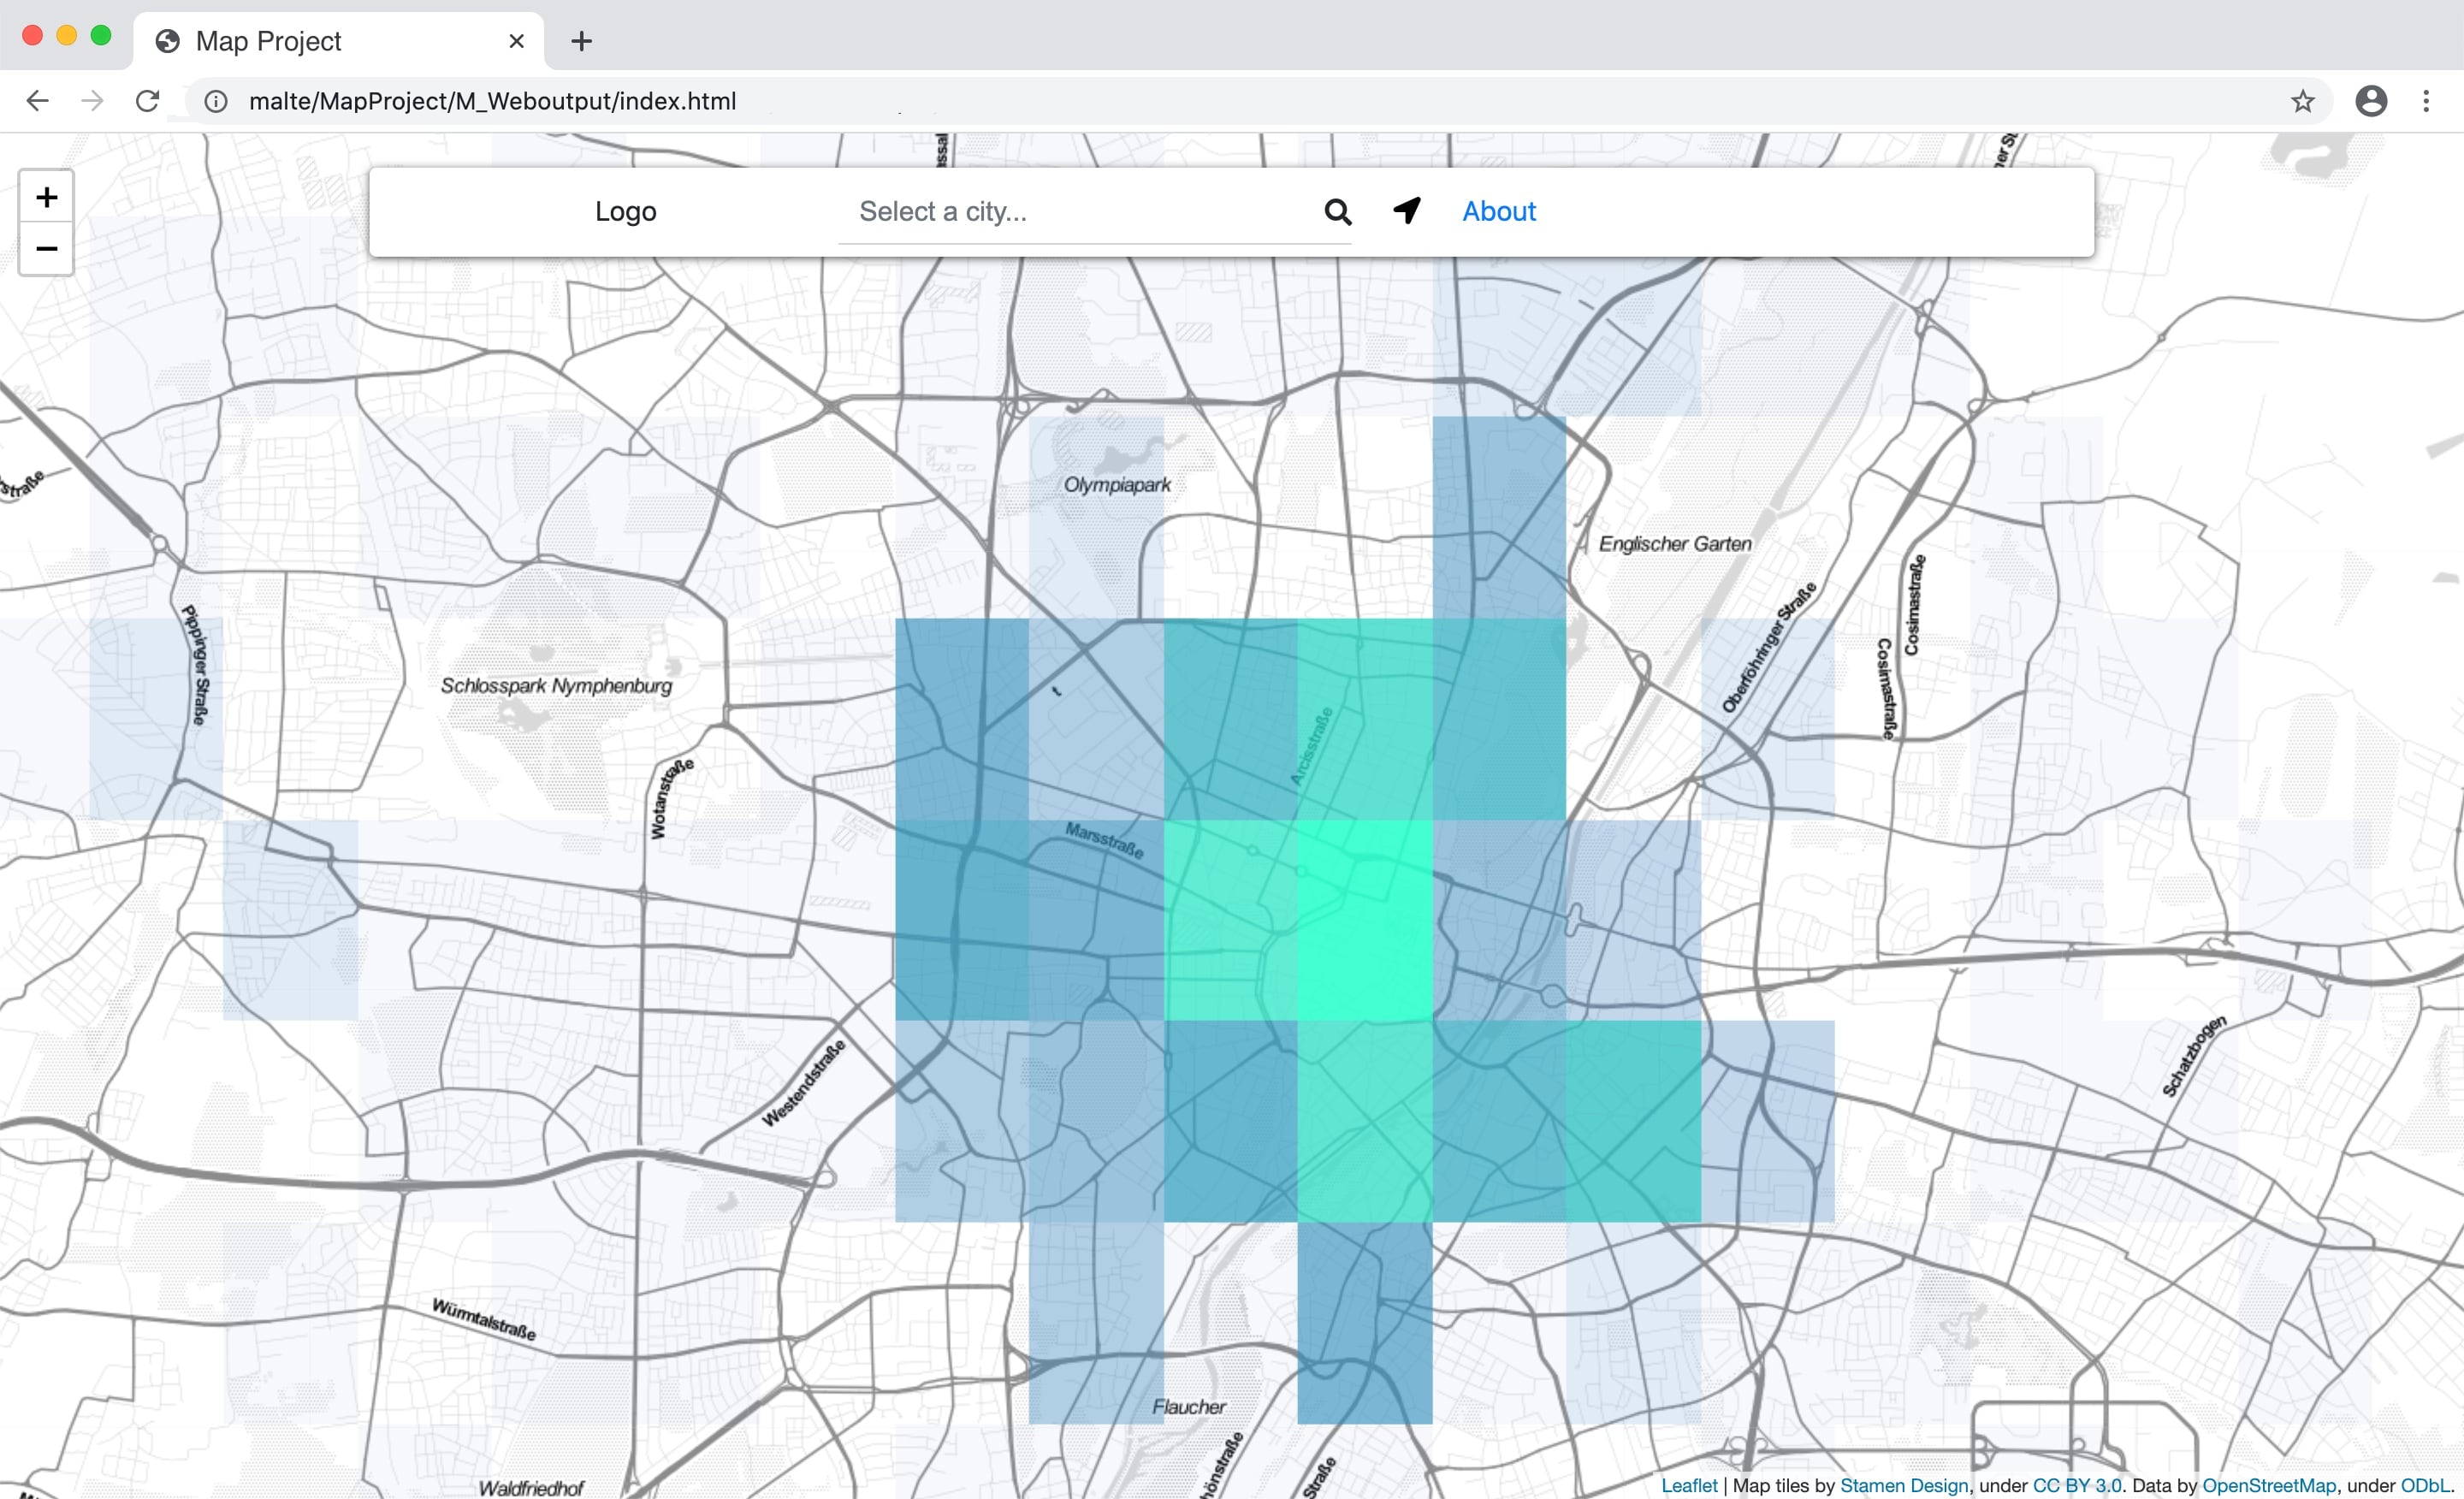
The visualization is pretty straight forward with a layer on an open street map representation done with leaflet.js. Simple but it does the job pretty well.

Conclusion and Points to Improve
The prototype works well in Munich and matches with the trending and uprising neighborhoods of the city. It could be scaled to more cities with additional real estate sources. In the next iteration an ML clustering algo would make more sense then calculating bins. This would lead to a more organic and realistic result and also would increase the speed of the app. The biggest downside of the concept is the collection of rental fees by crawling real estate websites. It is always a little boggy and not suitable for anything more than a PoC. This would require agreements with the real estate websites, so I leave it as a personal project and PoC just for the fun of coding and learning some new stuff.